IN-DEPTH READING
What does “three-dimensional information” mean?
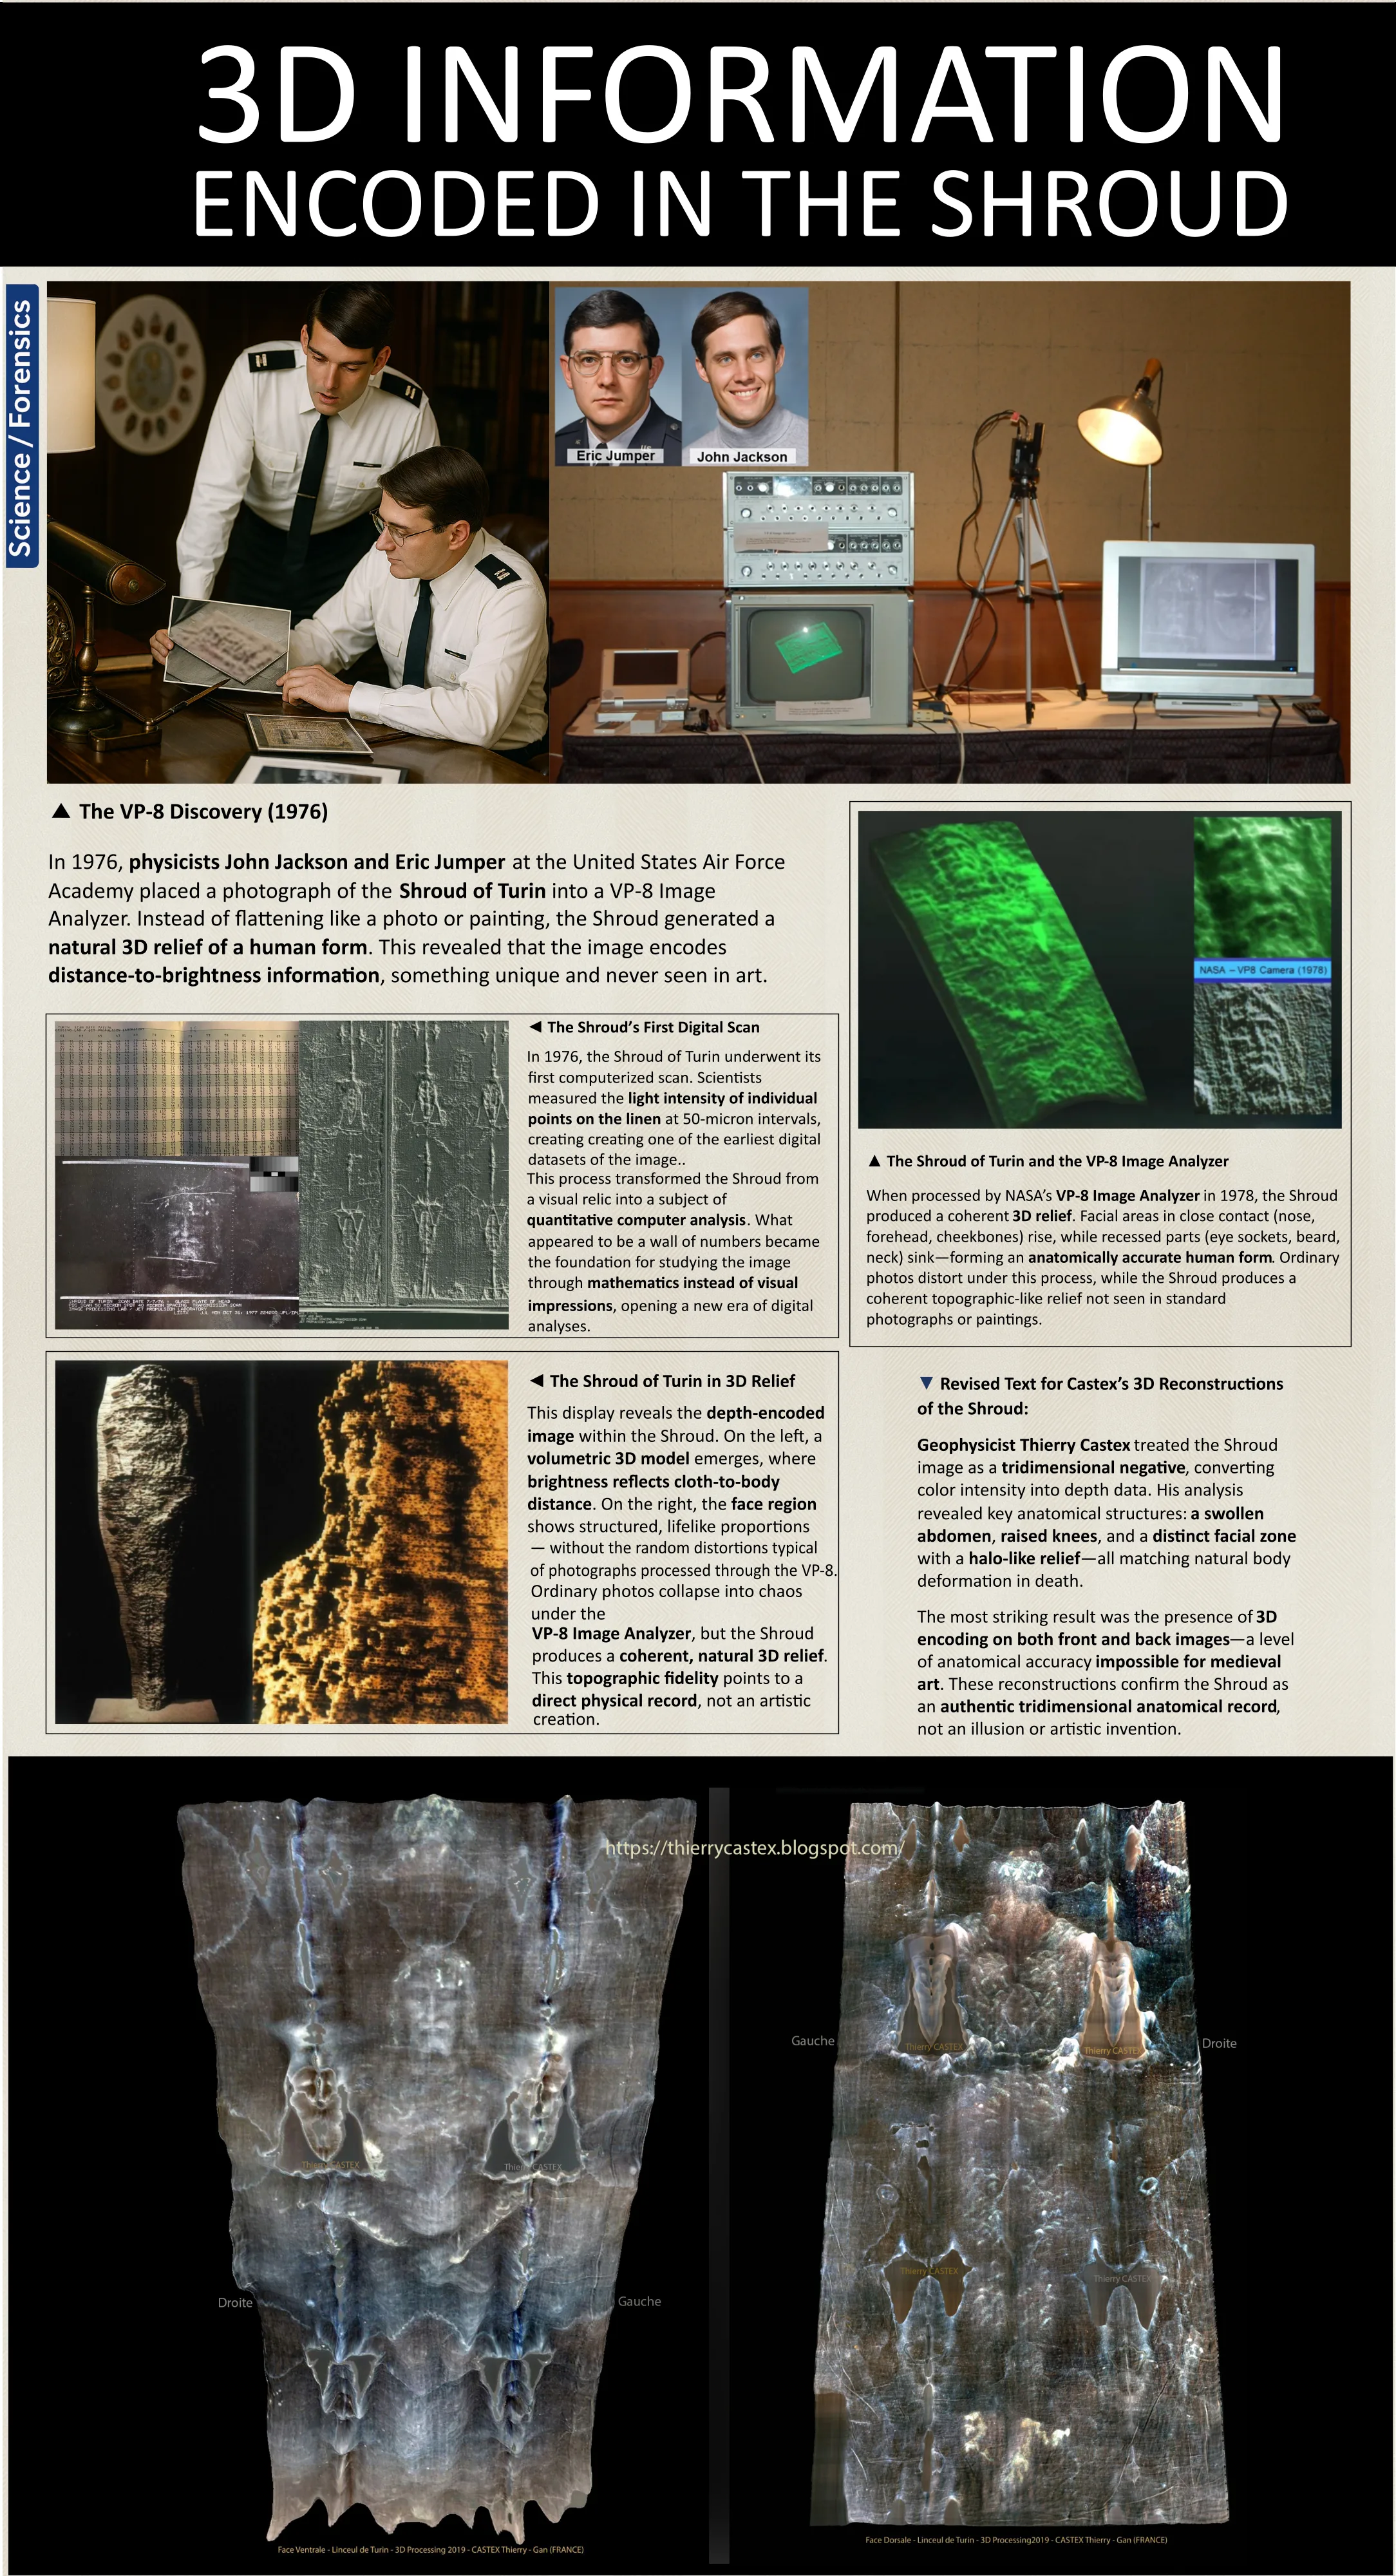
In 1976, researchers fed a photograph of the Shroud into an image analyzer designed to convert brightness into height. The screen produced a face in relief. That striking display launched a lasting question: does the cloth’s image intensity encode the distance between linen and a body, or can image processing make an ordinary tonal pattern look three-dimensional? To answer that, we need to separate the instrument’s output from the interpretation placed on it.12
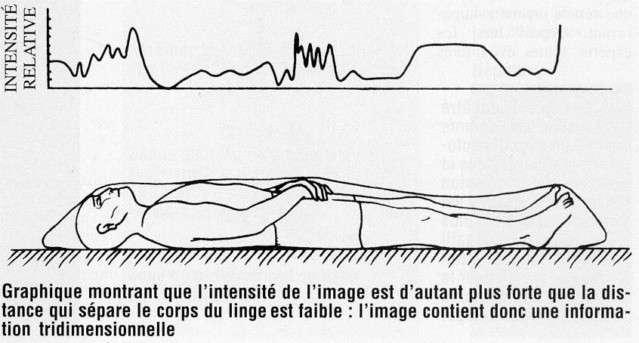
“Three-dimensional” is used for several different things in this debate. A VP-8 display is a relief rendering: a computer or analog circuit assigns height to brightness values. A statistical study may test whether brightness is correlated with a separately estimated cloth-to-body distance. A digital artist may use gray levels to build a mesh, rotate it, or make a hologram. These products can look alike, but they are not the same measurement. In particular, no VP-8 scan physically measured the buried body or the distance from it to the cloth.
1. The VP-8 experiment: a display that made people look twice
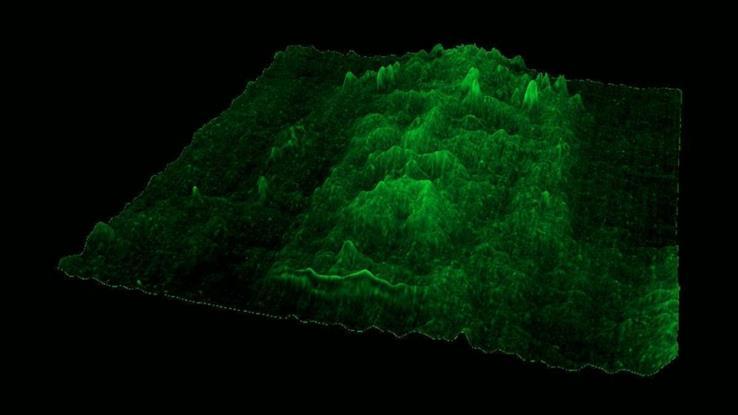
The VP-8 Image Analyzer was an analog image-processing instrument used to turn gray levels into a height-coded display. In a simplified model, a pixel’s brightness value, I, is mapped to a displayed height, z: z = f(I). The operator can choose the range and contrast. If the input is a topographic image, the result can resemble terrain. If it is a face photograph, the tonal shadows and highlights are also mapped as mountains and hollows; they need not correspond to the actual shape of the face.
In 1976, John Jackson and Eric Jumper, then working with the Shroud of Turin Research Project (STURP), examined a Shroud photograph with the VP-8. A technical account by Jackson, Jumper, Mottern and Stevenson was presented at the 1977 U.S. Conference of Research on the Shroud of Turin. The relief display of the Shroud’s frontal image appeared more coherent than the strongly distorted relief produced from many ordinary photographs. That was an intriguing observation and a useful prompt for further work. It did not, by itself, show that the brightness was caused by body-to-cloth distance: any grayscale image can be assigned heights by a suitable mapping, and a pleasing relief is not an independent depth measurement.13
Later summaries sometimes describe the VP-8 as if it were a device that “read” the Shroud’s encoded anatomy or proved that image brightness was distance data. That goes beyond what the instrument does. The VP-8 converts a tonal input into a topographic-looking output; interpretation depends on the input image, calibration, mapping, and comparison being tested. The researchers themselves treated the display as a clue, then developed a separate quantitative analysis.
2. The distance-correlation hypothesis
The proposal tested by Jackson and colleagues was more specific than “the face looks three-dimensional.” They asked whether optical density at selected places on the Shroud’s frontal image was related to the estimated distance that cloth would stand above corresponding parts of a human face under a proposed draping arrangement. If the hypothesis is correct, image intensity should vary systematically with that estimated separation. If the estimated distances are wrong, or if other image-making processes create similar tones, the correlation may not identify the cause.
Jackson, Jumper and William Ercoline’s 1984 paper in Applied Optics reports a correlation analysis at 13 facial locations. The researchers measured image density and compared it with distances derived from a reconstructed body and cloth profile. The reported coefficient of determination was r2 = 0.60. In ordinary language, within that small selected sample, the chosen distance estimates accounted statistically for a substantial portion of the observed variation under their model. The result is evidence that the proposed variables were associated in those data; it does not mean that 60% of the Shroud’s entire image is “depth,” nor that the body-to-cloth distances were measured directly.2
The paper reports a broad 95% confidence interval for the population r2, approximately 0.13 to 0.86. That interval reflects the limited sample: thirteen points cannot tightly determine the strength of a relationship. The authors explicitly discussed uncertainty in reconstructing the body, cloth profile and exact geometry. Their method therefore combines measured image density with model-based estimates of distance. It is a meaningful test, but its result depends on the anatomical correspondences and geometric assumptions used to assign those distances.
The authors also cautioned against treating a VP-8 picture as a substitute for quantitative sampling. A relief display is visually suggestive, but it cannot establish which mathematical relationship produced the input’s tonal pattern. Their paper called for larger and more objective measurements; it discussed the large number of points that would be needed to estimate the correlation with much greater precision.2 This qualification matters because later popular retellings sometimes turn a preliminary correlation into a precise, cloth-wide measurement. The 1984 paper does not justify that leap.
3. What the 1982 distortion study adds—and what it cannot settle
Ercoline, Robert Downs and Jackson examined whether the Shroud’s image showed distortions expected if a cloth had been laid over a three-dimensional form. They compared selected anatomical features and proposed wrapping geometries. Some measured distortions appeared compatible with a draped cloth model. Their article also reported that the data available to them were insufficient to distinguish conclusively between competing explanations. “Compatible with” is not the same as “uniquely predicted by,” and a model’s fit does not demonstrate that the proposed event actually occurred.4
The study is useful because it tests a geometrical expectation separate from the VP-8’s brightness-to-height mapping. Yet it also inherits uncertainty about how the cloth was arranged, how the body surface is reconstructed from the flattened image, and which points are reliable enough to measure. It should be read as a test of a draping interpretation, not as a direct three-dimensional survey of the cloth or body.
4. Why a plausible relief does not identify the process
A grayscale photograph contains one value per pixel. A three-dimensional surface contains at least two spatial coordinates and a height. To display a photograph as a surface, software must supply a rule that maps gray values to height. The resulting surface can be turned around and inspected, but it remains a transformation of the original two-dimensional values. The relief is not a hidden object recovered without assumptions.
This distinction also explains why the phrase “ordinary photographs do not produce a 3-D image” is too broad. Most photographs do not encode distance in a simple, globally consistent way; lighting, reflectance, exposure and shadows affect their gray levels. But a grayscale image of a sculpted bas-relief, or a carefully designed image, can yield a coherent height map when tones are chosen to correspond to surface height. The fact that an image produces an intelligible relief is noteworthy; it is not a unique signature that rules out every artistic or physical process.
Jackson, Jumper and Ercoline discussed a bas-relief experiment and several candidate mechanisms. They considered whether contact with a heated low-relief object might produce an image whose intensity depended on separation. They recognized possible strengths as well as serious difficulties, including the required superficiality, image distortion, one-sidedness and the effect on pre-existing blood marks. Their paper did not establish a single mechanism that reproduces all observed properties. In the same way, a proposed radiation or vapor mechanism that explains one feature does not thereby explain the whole image. Each proposed process must be tested against the full set of observations, and the strength of each observation must itself be assessed.2
Diagram. Illustrative only. Changing the brightness-to-height rule changes the relief. A separate validation is required to show that the values correspond to real cloth-to-body distances.
5. Later digital processing and holography
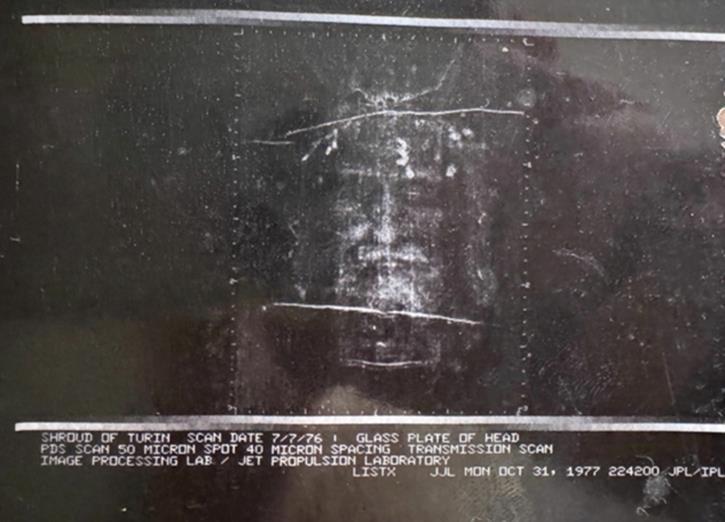
As computers became more capable, researchers and enthusiasts applied filtering, contrast adjustment, edge enhancement, three-dimensional rendering and stereoscopic display to photographs of the Shroud. Giovanni Tamburelli published computer-processing work on the Shroud face in 1981. Such techniques can make faint patterns easier to inspect, but enhancement is not neutral: denoising, sharpening, contrast and interpolation may suppress, exaggerate or create apparent details. A processed image should therefore be accompanied by the original input, a description of the operations, and enough information for another analyst to reproduce the result.5
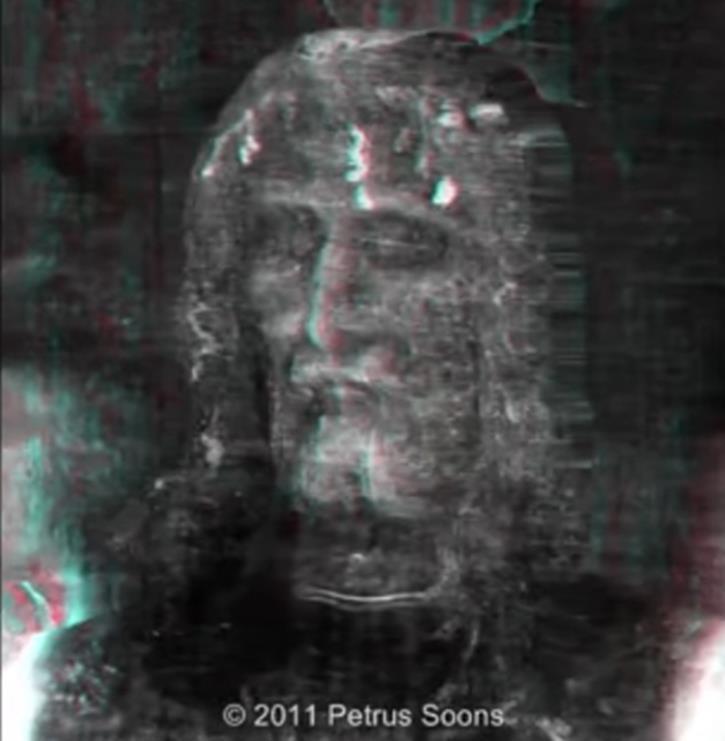
Petrus Soons later used digitized Shroud photographs, gray-scale processing and holographic display to make reconstructions that viewers could examine from changing angles. Those works are best described as holographic visualizations generated from photographs. They are not holograms recorded directly from the cloth, nor 3-D scans of the linen or an underlying body. The angles, depth scale, image source, corrections and synthesis steps are part of the reconstruction. Their value is illustrative and exploratory; any claim that a new feature is physically present on the cloth requires verification against the original photographs and independent imaging methods.6
These later renderings are often discussed alongside the original VP-8 experiment, but they answer different questions. The VP-8 made an analog relief display; statistical work tested a selected brightness-distance relationship; a hologram or 3-D mesh presents a constructed view. Agreement between visualizations that share the same source photograph and tonal assumptions is not fully independent replication.
6. A recent geometric challenge: full body or shallow relief?
In a 2025 article published online and included in a 2026 issue of Archaeometry, Cicero Moraes and colleagues compared digital cloth simulations associated with a full human form and a low-relief form. They argued that, in their modeling, a shallow relief could produce a closer visual match to certain Shroud-image proportions than a cloth draped over a full body. This challenges the assumption that the image geometry necessarily requires a complete three-dimensional body beneath the linen.7
The study is a computational reconstruction. Its result depends on the chosen digital geometry, cloth properties, draping or contact rules, photographic reference and comparison criteria. It does not reproduce the Shroud’s chemistry, test bloodstains, measure image fibrils, date the linen, or identify the historical process that made the image. A published commentary by Tristan Casabianca and colleagues disputes aspects of the modeling and interpretation, including whether the analysis adequately supports the low-relief conclusion. The exchange shows that the geometry remains debated; neither the original paper nor the commentary turns a model into a direct observation of the cloth’s formation.8
7. How the Shroud’s 3-D claim should be evaluated
A careful assessment asks several separate questions. First, can the reported display be reproduced from an identified, unaltered photograph? Second, are image tones measured consistently and are processing choices documented? Third, are distances measured independently, or assigned from a body-and-drape model? Fourth, were the anatomical points selected before analysis, and are there enough points to estimate uncertainty? Fifth, do alternative image-making models predict the same relationship? Finally, do the same conclusions hold across the frontal and dorsal images, different photographs, and independent laboratories?
These questions do not dismiss the observation. The VP-8 display is historically important, and the 1984 study reported a non-random association between image density and the investigators’ modeled distances at selected facial points. The 1977 proceedings add a technical limitation: a direct linear brightness-to-height display can distort apparent relief because the proposed opacity-versus-distance curve is nonlinear. John D. German described an electronic transfer-function circuit intended to reshape the VP-8 signal to approximate that curve. Thus the striking uncorrected display was not itself a calibrated distance map, and the proposed correction depended on a model of the opacity-distance relationship. The proper conclusion is narrower than many popular accounts: researchers found a potentially meaningful tonal-geometric relationship under a specified reconstruction, but the distance estimates were model-based, the sample was small, and the mechanism remains unresolved.120 New work could strengthen or weaken the hypothesis by publishing raw image data, calibration, point selection, uncertainty ranges and reproducible cloth/body models.
How a grayscale image becomes a stack of “height” values
There was an important precursor to the VP-8 episode. In 1967, photographer Leo Vala reported projecting a Shroud negative onto a clay surface and sculpting a facial relief to match the projected image. This was a manually constructed model: the projection supplied a visual guide, and the sculptor supplied the depth. It showed that a two-dimensional image could be used to build a relief, but it was not a measurement that the original cloth encoded calibrated body distance. A later account in The Ampleforth Journal describes the experiment and points readers to Vala’s contemporary photography-press reports. P. Gastineau’s early face-relief work is dated 1973 in one account and 1974 in another; “early 1970s” is therefore more secure than one exact year.19
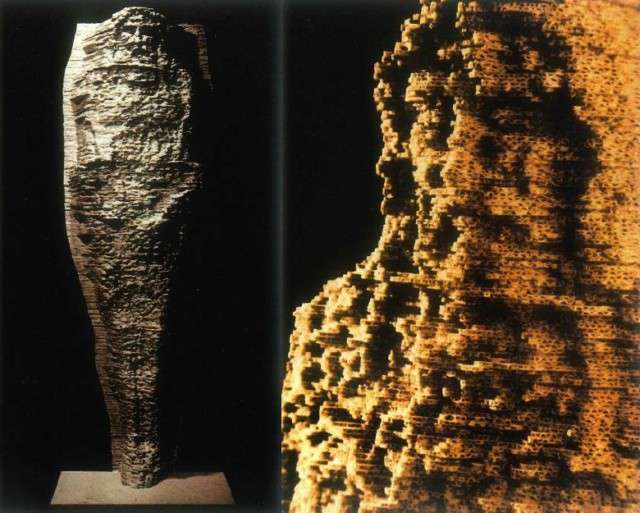
The phrase stacked planes describes how a sampled height field can be turned into a physical contour model. Imagine a grayscale photograph divided into pixels. A computer can assign each pixel a vertical coordinate, then place the pixels at those heights in a grid. In a contour model, the same surface can be approximated by many thin horizontal slices: each slice traces one height band, and the slices are stacked to form a stepped relief. A physical version can be made from cardboard cut-outs; a digital version can be viewed as a mesh, shaded surface or point cloud.
This is a model of the image’s tone field. The stack does not contain independently measured anatomical slices, and its height scale is not automatically centimetres of historical cloth-to-body separation. The output depends on the brightness-to-height rule, image polarity, contrast, calibration, smoothing and vertical exaggeration. A contour stack can look compelling while still representing an algorithmic conversion of a flat photograph. The critical experimental question remains whether the assigned heights agree with an independently known geometry.
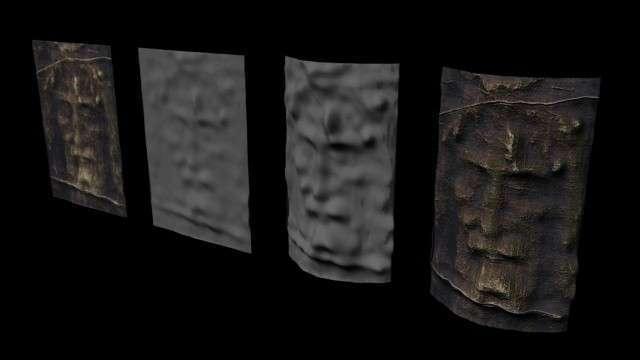
From virtual relief to a physical contour model
A physical contour model was displayed at the 1977 Albuquerque conference. The 2026 account identifies it as a cardboard statue made by STURP members and Air Force Academy cadets from VP-8-derived relief data, and notes that fire damage to the arm image affected its appearance. The proceedings document the scientific presentations and the proposed density-to-distance relationship; construction details of the model are reported in the later account and are cited here accordingly.112 A layered contour model turns the screen’s topography into something viewers can walk around and inspect. It is a useful way to understand what “relief” means: the display is no longer a flat screen, yet its shape still originates in the gray values and mapping decisions of the source image.
Such a model should not be confused with a forensic reconstruction of every anatomical feature. It cannot establish the man’s body dimensions unless the horizontal and vertical scales, perspective, draping correction and image registration are calibrated. Missing or damaged image regions must be interpolated or left blank; the fire damage, cloth folds, scorch marks and blood marks can disturb the height field. A cardboard stack visualizes a proposed surface. It does not prove how that surface was made or which mechanism produced the original linen discoloration.
Different forms of 3-D visualization
“The 3-D image” is not one image. Several distinct outputs appear in the literature, each with its own source data and processing history:
| Image type | What it does | What it does not establish by itself |
|---|---|---|
| VP-8 relief display | Maps an analog video signal’s intensity into vertical displacement on a screen. | That displayed height equals measured physical distance, or that a unique image-forming mechanism is known. |
| Microdensitometer / numerical scan | Samples optical density at selected points or scan lines. | That model-based body distances have been independently measured at every corresponding point. |
| Layered contour model | Physicalizes a height field using stacked planes or contours. | That the figure is a complete anatomical statue or a scale-accurate body reconstruction. |
| Digital height field or mesh | Assigns pixel values to a surface and allows rotation, smoothing, false color or perspective changes. | That processing choices are neutral, or that the output adds independent information beyond the input photograph. |
| Red/cyan stereo or hologram | Presents a constructed depth view or changes perspective for an observer. | That the cloth was recorded by holography, or that every newly visible detail is physically present on the linen. |
| Computerized cloth/body simulation | Compares predicted shapes under specified body, cloth and contact assumptions. | That the simulation recreates the historical event, chemistry, blood transfer or image formation. |
This list also clarifies why a “stack” of slices and a 3-D image can be useful yet still theoretical. A stack turns sampled values into a volume-like display; the display’s shape depends on the assumptions used to place the samples. Only data acquired independently in three spatial dimensions—for example, a validated scan with a physical depth sensor—would directly measure a present surface’s three-dimensional shape. It still would not reveal the process that formed an ancient image.
Digital image processing: what Castex did
Thierry Castex’s published front and back renderings describe a color-processing workflow. In that description, the red, green and blue channels are separated and treated as individual 8-bit grayscale images, processed, and recombined. Castex describes applying a two-dimensional Fourier-domain filter to reduce weave patterns and streaks, then equalized pixel amplitudes using an L2 norm to harmonize intensity and reduce background variation. These operations can make broad shapes easier to see, but they also change the signal. Filtering and equalization should therefore be disclosed whenever the image is used to infer a faint outline, height, color or missing object.1217
Castex’s web account presents the dorsal relief as less pronounced and more disturbed around the back and buttocks, where scourge marks complicate the conversion. He interpreted the back hair as thick and extending downward. He also identified a region that appeared to lack scourge marks and proposed that it might correspond to a fold or an absorbent cloth. He connected the region to holes depicted in the Codex Pray. These are interpretations of a processed image, not direct observation of the physical back under controlled color calibration. The 2012 account itself says that color measurement would need spectrophotometric calibration and phrases the fold/absorbent-cloth explanation as a hypothesis.17
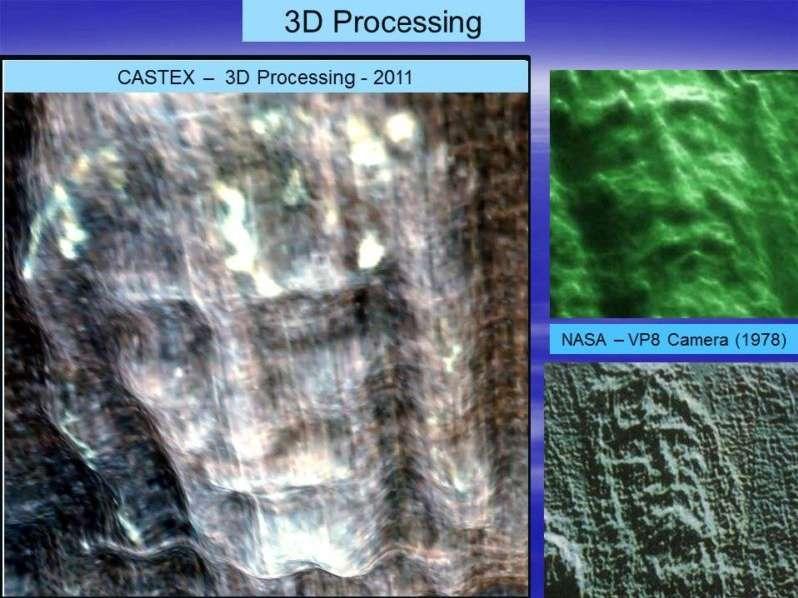
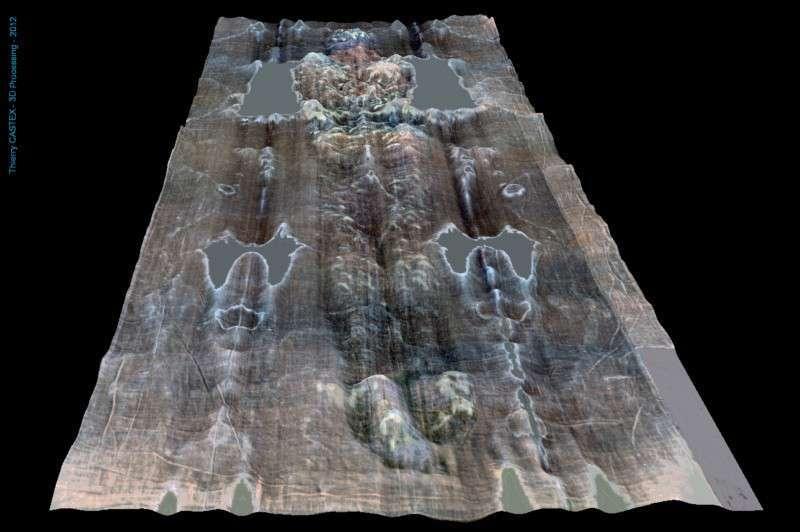
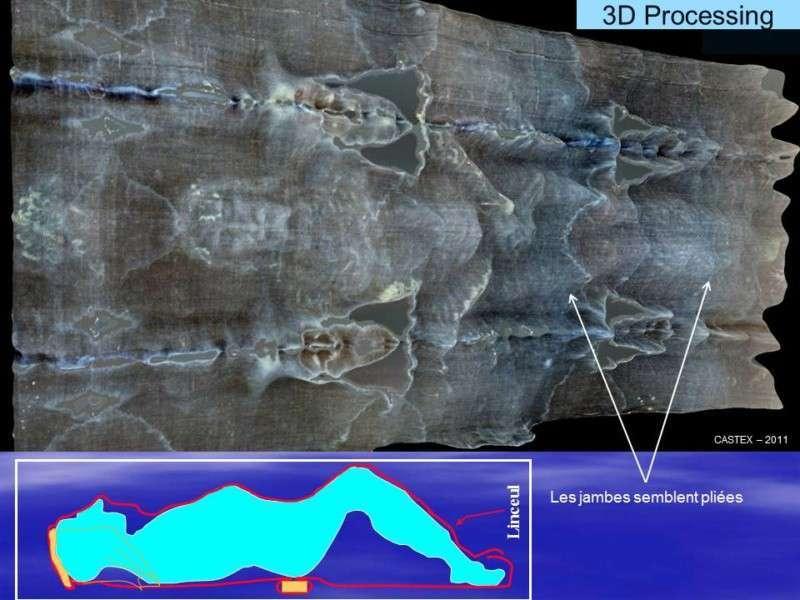
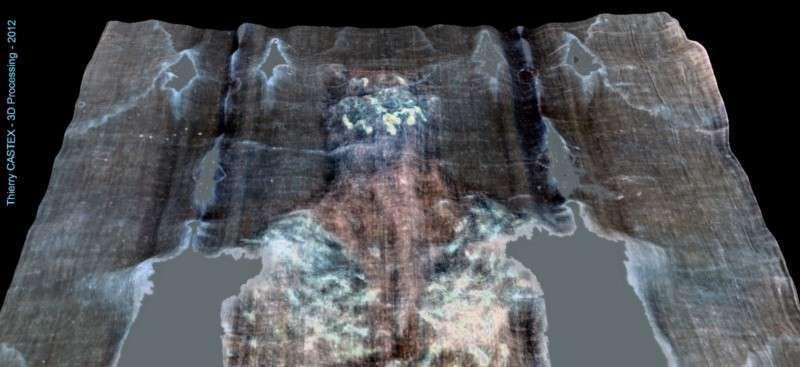
In the newer 2024 post, Castex describes his results as revealing a dark facial halo, raised knees, a swollen-looking abdomen and dorsal depth information. He also cautions that the color rendition would need spectrophotometric calibration. Those observations are valuable as leads for further study. A digitally produced color surface cannot independently establish the original linen’s color values, and a shape that becomes visible after filtering is not automatically an object or feature present in the unprocessed source.18
Holographic views and reconstructed depth
The Soons project starts with digitized Enrie photographs, applies image enhancement and gray-level-to-depth conversion, and generates many views that can be combined for holographic display. Project descriptions report sequences of up to 625 frames. That number describes a set of views used for the display, not 625 independent measurements of the cloth. A viewer can see parallax and inspect a model from different angles, but the underlying height field remains reconstructed from two-dimensional photographic input and chosen depth mapping.611
One interpretation treats the frontal relief as compatible with non-contact, distance-dependent formation, while assigning direct contact to the dorsal image. This is a hypothesis about image formation, not an observation of the event. Castex’s later digital dorsal relief is a separate processing result and does not resolve whether the original dorsal image was contact-formed or distance-encoded. Researchers have also proposed that dark or image-less regions around the face might correspond to objects, including flowers. Such identifications require independent confirmation: processing can make faint contrasts more conspicuous, but cannot by itself distinguish stable cloth features from photographic artifacts, weave, damage or noise. A hologram provides a three-dimensional viewing effect; it does not mean the Shroud was recorded holographically.
How to read the theoretical mechanism “stack”
The 3-D debate also contains a stack of explanations—each with a different physical claim. These explanations should not be blended simply because they can all be illustrated with a relief image:
- Brightness mapping: an instrument assigns height to gray level. This explains how the display is made, not how the cloth acquired its tones.
- Distance correlation: image intensity is compared with a modeled cloth-to-body separation. This is a statistical relationship conditioned on the geometry and sampled points.
- Distance-dependent formation: a physical process is proposed in which image-forming energy or material varies with separation. Radiation, vapor and other models differ in predicted chemistry, resolution, direction and intensity falloff. A correlation alone does not identify which mechanism, if any, operated.
- Contact or bas-relief transfer: cloth touches a sculpted or shaped surface; pressure, rubbing, heating or another contact effect changes the fibers. Experiments have shown that some relief-like patterns can be made, but whether a particular experiment reproduces all reported Shroud features is disputed. The comparison must include fiber penetration, image polarity, blood, distortions and full-cloth consistency—not just a convincing VP-8 display.
- Cloth geometry after formation: orthogonal projection and cloth-collapse scenarios try to explain why the image appears relatively free of side wrapping. These are geometric models, not direct observations of a body leaving cloth. Their predictions need independent tests and should not be used circularly to assume the distance map they are then invoked to explain.
The proposed distance-dependent and draping models cited below set out constraints that a successful mechanism would need to meet. They remain hypotheses: a model’s ability to organize observations does not independently confirm its premises. The evidence review also cautions against treating exact VP-8 body-distance claims or speculative radiation and corona mechanisms as established facts.131415
Conclusion: an intriguing image property, not a solved mechanism
The Shroud’s tonal pattern can be rendered as an unusually legible relief, and a 1984 study reported a statistical association between facial image intensity and distances estimated from a draping model. Those findings make the three-dimensional question worth examining. They do not show that the VP-8 physically recovered depth, that every part of the image encodes distance, or that one particular physical mechanism has been demonstrated.
The defensible account preserves both the interest and the limits: a historical instrument produced a striking display; a small-sample study tested a specific model-based correlation; later digital and holographic works created further visualizations; and modern simulation has reopened questions about the geometry. The evidence supports continued measurement and comparison. It does not, on its own, settle the Shroud’s date, identity, authenticity, or image-making process.
SOURCES & FURTHER READING
References
- Jackson, J. P., Jumper, E. J., Mottern, R. W., & Stevenson, K. E. (1977). “The Three-Dimensional Image on Jesus’ Burial Cloth.” In Proceedings of the 1977 U.S. Conference of Research on the Shroud of Turin. Full proceedings (PDF).
- Jackson, J. P., Jumper, E. J., & Ercoline, W. R. (1984). “Correlation of Image Intensity on the Turin Shroud with the 3-D Structure of a Human Body Shape.” Applied Optics, 23(14), 2244–2270. https://doi.org/10.1364/AO.23.002244 · Full paper (PDF).
- Schwortz, B. (n.d.). “The 1978 Scientific Examination.” The Shroud of Turin Website. Research archive; see also “The 1978 STURP Summary.” Team summary.
- Ercoline, W. R., Downs, R. C., Jr., & Jackson, J. P. (1982). “Examination of the Turin Shroud for Image Distortions.” In Proceedings of the International Conference on Cybernetics and Society, 576–579. Paper (PDF).
- Tamburelli, G. (1981). “Some Results in the Processing of the Holy Shroud of Turin.” IEEE Transactions on Pattern Analysis and Machine Intelligence, PAMI-3(6), 670–676. https://doi.org/10.1109/TPAMI.1981.4767168.
- Soons, P. (n.d.). “The Shroud of Turin: The Holographic Experience.” Conference paper and project description. Conference paper (PDF) · Project website. The reconstructions are derived from photographs and processing, not direct holographic recording of the cloth.
- Moraes, C. (2026; first published online 28 July 2025). “Image Formation on the Holy Shroud—A Digital 3D Approach.” Archaeometry, 68(1), 84–93. https://doi.org/10.1111/arcm.70030.
- Casabianca, T., et al. (2026). “Commentary on “Image Formation on the Holy Shroud—A Digital 3D Approach.”” Archaeometry, 68(4), 861–863. https://doi.org/10.1111/arcm.70109.
- Garlaschelli, L. (2010). “Life-Size Reproduction of the Shroud of Turin and Its Image.” Journal of Imaging Science and Technology, 54(4), 040301. https://doi.org/10.2352/J.ImagingSci.Technol.2010.54.4.040301. See also Fanti & Heimburger’s response (2011), https://doi.org/10.2352/J.ImagingSci.Technol.2011.55.2.020102.
- Baldacchini, G., et al. (2008). “Coloring Linens with Excimer Lasers to Simulate the Body Image of the Turin Shroud.” Applied Optics, 47(9), 1278–1285. https://doi.org/10.1364/AO.47.001278; Di Lazzaro, P., et al. (2010). “Deep Ultraviolet Radiation Simulates the Turin Shroud Image.” Journal of Imaging Science and Technology, 54, 040302. https://doi.org/10.2352/j.imagingsci.technol.2010.54.4.040302. These studies explore limited linen-coloration effects; they do not establish a full-scale distance-encoding mechanism.
- Grasso, O. (2026). The Shroud of Turin: A Forensic Summary of the Evidence, 3rd ed., Chapter 6, pp. 111–127. Amazon book listing. Illustrations are cited where used in the text.
- Grasso, O. (2026). From Forensics to Faith, revised 2026 edition, Chapter 5, “3D Information Encoded in the Shroud.” Amazon listing.
- Grasso, O. (2025). The Shroud of Turin VP-8 Analysis: Scientific Evaluation and Historical Context. Author’s essay; marked as AI-assisted. Download author’s PDF. This is an interpretive essay, not an independent peer-reviewed study.
- Grasso, O. (n.d.). The Draping Configuration of the Shroud. Author’s proposed geometric model. Download author’s PDF. A model for evaluation, not a settled reconstruction.
- Grasso, O. (n.d.). A Consolidated Illustrated Critical Assessment of Shroud Evidence. Author’s synthesis. Download author’s PDF.
- Grasso, O. (n.d.). Shroud of Turin Image Requirements and Proposed Explanations. Author’s framework. Download author’s PDF.
- Castex, T. (2012, September 1). “Vues 3D de la face dorsale du Linceul de Turin / 3D Dorsal Views of the Shroud.” Étude de l’image du Linceul de Turin. Castex describes the image processing, front/back reliefs and his interpretation of the dorsal unmarked region. Author’s article and images.
- Castex, T. (2024, July 7). “Apport des nouvelles images 3D du Linceul de Turin.” Étude de l’image du Linceul de Turin. Author’s 2024 discussion of later 3-D renderings.
- “The Shroud and the Three-Dimensional Image.” The Ampleforth Journal, 74 (Spring 1969), discussion and contemporary account of Leo Vala’s two-projector, clay-screen relief process; it cites Vala’s contemporary 1967 articles in Amateur Photographer (8 March) and British Journal of Photography (24 March). Journal issue (PDF).
- German, J. D., Jr. (1977). “An Electronic Technique for Constructing an Accurate Three-Dimensional Shroud Image.” In Proceedings of the 1977 U.S. Conference of Research on the Shroud of Turin, pp. 234–245. The paper describes the VP-8 transfer-function correction for a nonlinear opacity-versus-distance model. Full proceedings (PDF).